Introduction
Temperature dependence (TD) anomalies for a number of water’s physical properties become apparent in their extremal behavior. ТDs of volumetric density
(ρ), thermal capacity at constant pressure (Ср), compressibility coefficientи (γ) and sound velocity (V) have their extremal values at t ех = 4, 35, 45 and 75 ºС, respectively. By ТDs linear approximation, it has been found in [1] that, along with point 25 ºС, Тех may
appear in form of curving on various ТDs. For instance, apart from point 35 ºС, curving at 4 ºС, 25 ºС, 75 ºС on ТD of Ср can be detected, while
on ТD of dynamic viscosity (η) all the point (4 ºС, 25 ºС, 35 ºС, 45 ºС, 75 ºС) appear in form of curving. Point 25 ºС becomes apparent on ТDs of surface
stress factor, diffusion coefficient (D) and dielectric relaxation time (τ). Thus, tех points divide ТDs to form quasi-liner fragments
characterized by different activation energies (ЕА) for water structure reforming.
The molecular mechanism of water structure reforming, as well as that of tех values differentiation are not perfectly clear yet. Evidently, the
dynamics of fluctuating hydrogen bonds (НВ) [2, 3] and supramolecular water clusters play the key role in these mechanisms. Water structure is mainly
studied with the use of spectral analysis method, including X-ray absorption and narrow-angle diffusion [4-6].The data obtained for statistically averaged
water molecule on the НВs’ asymmetry and the dynamics are used to build computation models for lattice-like water structure [7]. Optical methods (laser
interferometry [8], polarimetric measurements [9, 10]) have to be mentioned among alternative techniques used to study the supramolecular structure of
water and water solutions. Additional information on water anomalies can be obtained based on investigating water solutions’ physical-chemical properties.
Analysis of linear approximations of experimental ТDs [1] appeared to be rather effective in studying molecular dynamics. It made it possible to
differentiate the origin of molecular restructuring apparent in ТDs of water’s properties depending on their ЕА values and to define the values
of ЕА for optical activity in water solutions and organic solutions from experimental ТDs.
Today, the model dominates that considers two water fractions that differ in their НВ’s local density and organization [1, 4-7]. In this model, B-fraction,
the denser one, is formed on the basis of dimers and short chains of molecules while A-fraction has lower НВ density and is formed by a fluctuating lattice
build of tetrahedral НВs. The lattice structure is formed by energetically favorable clusters having lifetimes of >10–9 s [10]. Among cluster
structures, hexagonal ice-like structures (W6-clusters) [6] and tetrahedral spiral chains built of НВs (Wα-clusters) are
distinguished [1, 12].
Accordingly, molecular dynamics of liquid water can be provisionally attributed to two types [1]. Restructuring of B-fraction, mainly limited by HB
breaking reaction with kinetic constant of an order of magnitude 1011 to 1013 s–1 and EА~7-21 kJ/mol, is
classified as I type. Dynamics of А-fraction structures belongs to type II in which rotation-orientation molecular motion dominates. Wα- and W 6-clusters may be contained in various supramolecular structures (SMS) and in hydrate shells of molecules capable to build НВs [6]. SMSs are
registered by optical methods in macro-scale. Their dimensions are 1 m to 100 m while their lifetimes are in the range from 1 s to 30 s [6, 8].
Useful data on molecular dynamics of water were obtained from multiple studies of sugar solutions. In practice, ТDs for specific rotatory power ([α]) of
sugars are normally described with the use of power functions of concentration and temperature (t оС):
[α] = 3.3492 – 0.0012 t (saccharose) [13], (1)
[α] = –100.3 + 0.56 t – 0.108 С (L- fructose) [14]. (2)
Approximations (1) and (2) are valid in the ranges of 20 ºС to 25ºС and 0 ºС to 40 ºС, respectively. It has been found in [9] that ТDs for optical activity
for sugars’ solutions have kinks at temperatures ranging from 23 ºС to 26 ºС.
In order to study the water’s structure self-organization the method of linear approximation was applied to analyze the data obtained in this paper, as
well as those on temperature dependences of chirality for sugar solutions in water reported in literature.
Materials and Methods
Optical activity of water solutions of NaCl, glucose (GL) and dextrane (DX) has been studied. Water samples treated in cleaning plants Milli RO and Milli Q
(WQ) was used. The following physiological solutions were purchased at pharmacies: isotonic (PhS), GL and DX. These solutions had the following components’
concentrations in 100 g water for injections:
PhS – 0.9 g NaCl,
GL – 40 g dextrose monohydrate; 0.1 М НCl to рН 3.0-4.0; 0.26 g NaCl,
DX – 10 g dextrane with molecular mass 30,000 to 40,000 and 0.9 g NaCl,
Rotation angle of polarization plane (α) for monochrome radiation (λ=589 nm) was measured with the use of circular polarimeter ‘SM-3’ (metering accuracy:
±0.04º) in measuring cells 1 dm and 2 dm long.
Measurements were performed at room temperature (tr = 24 ºС ±2 ºС) and outdoors (in a balcony) at temperatures that varied in the range of 2 ºС
to 25 ºC, during the period from March to May, 2015.
Temperature was measured with a mercury thermometer (metering accuracy was ± 0.1 ºC) in a beaker with water located near the polarimeter. The beaker was
like a cell 2 dm and was in an iron cylinder near the polarimeter.
Prior to measurements, «0» point of the device was adjusted by measuring α without a measuring cell, with the empty cell 2 dm long at tr = 24 ºС
and on the balcony at t = 4 ºС and 11 ºС. In all cases, the device indicated 0.38º±0.03º. This value did not change while measuring α of pure water (WQ)
and PhS in the same cell, in identical conditions. Therefore it has been proved that the values indicated by the device did not depend on temperature, and
that WQ, as well as PhS solution, are optically inactive at t = 4-24 ºС.
Physical-chemical properties of water and water solutions are defined by not only their structure but also by concentration (С) of dissolved molecules. The
dependence of distance between adjacent molecules (Rmm) on their concentration can be estimated as:
Rmm = 1.18 C–1/3, (3)
where Rmm is expressed in nm and С is in mol/l.
The values of effective ЕА in the relevant temperature ranges of ТDs were evaluated by approximation of experimental points with the use of
Arrhenius formula ехр(±ЕА/RT) where
R = 8.31 Jmol–1K–1 is absolute gas constant. Reported data on ТD were translated into digital form using PC with Microsoft Office
Excel application. As an example, Figure 1 shows Arrhenius approximations for ТDs of type (1) for [α] of camphor reported in [15] in coordinates of
“ln([α]/[α]о) – 1/Т”. Minimal values of [α] were chosen as [α]о. Value (β) of the linear trend of the curve slope were applied to
calculate ЕA = βR. Obtained ЕA values for a number of terpenes are given in Table 1. Similarly, the values ЕA [α] for
saccharose were determined from the data reported in [13].
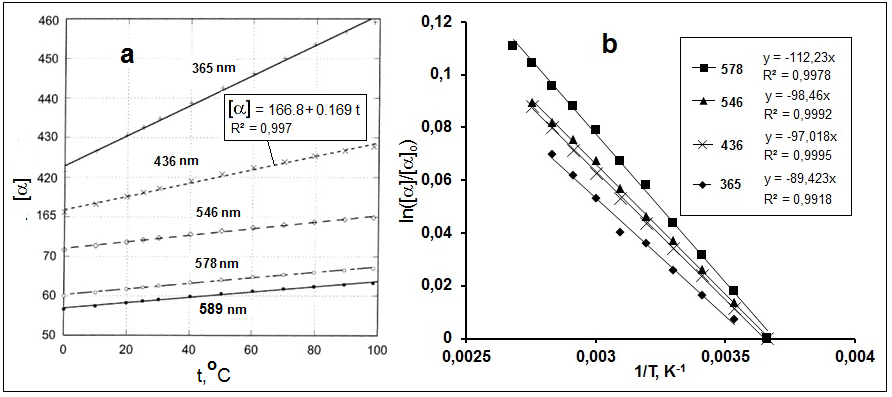
Figure 1. Temperature dependences of specific rotation for сamphor in ethylcyclohexane for various wavelengths (а) from [15] and their Arrhenius
approximations (b).
Table 1.
Activation energy of
specific rotation for terpenes in ethylcyclohexane
|
λ(nm)
|
Pinane
|
α-Pinene
|
β-Pinene
|
Fenchone
|
Camphor
|
|
ЕA
|
[α]λ*
|
ЕA
|
[α]λ
|
ЕA
|
[α]λ
|
ЕA
|
[α]λ
|
ЕA
|
[α]λ
|
|
365
|
1.0
|
76
|
-0.23
|
149
|
4.8
|
-11
|
0.8
|
-158
|
-0.7
|
430
|
|
436
|
1.1
|
47
|
-0.19
|
97
|
-4.4
|
16
|
0.9
|
-111
|
-0.8
|
170
|
|
546
|
1.1
|
26
|
-0.15
|
55
|
-2.4
|
19
|
1.1
|
-56
|
-0.8
|
74
|
|
578
|
1.2
|
23
|
-0.15
|
51
|
-2.3
|
18
|
1.1
|
-48
|
-0.9
|
62
|
|
589
|
1.2
|
22
|
-0.15
|
48
|
-2.2
|
18
|
1.1
|
-46
|
-0.9
|
58
|
|
δ** (% oС–1)
|
0.013
|
0.017
|
-0.24
|
-0.12
|
0.11
|
*) – for all values of λ at 20 ºС; **) – for λ = 589nm, from [15].
Along with ЕA values, temperature gradient (δ) of ТDs was studied for comparative analysis using the following formula:
δ = (Δχ/Δt)χ–1 100 (% ºС –1) [1]. (4)
where χ is a parameter defining water’s property or solution chirality.
Results
Data on monitoring the temperature and chirality of GL and DX solutions are presented in
Figure 2.
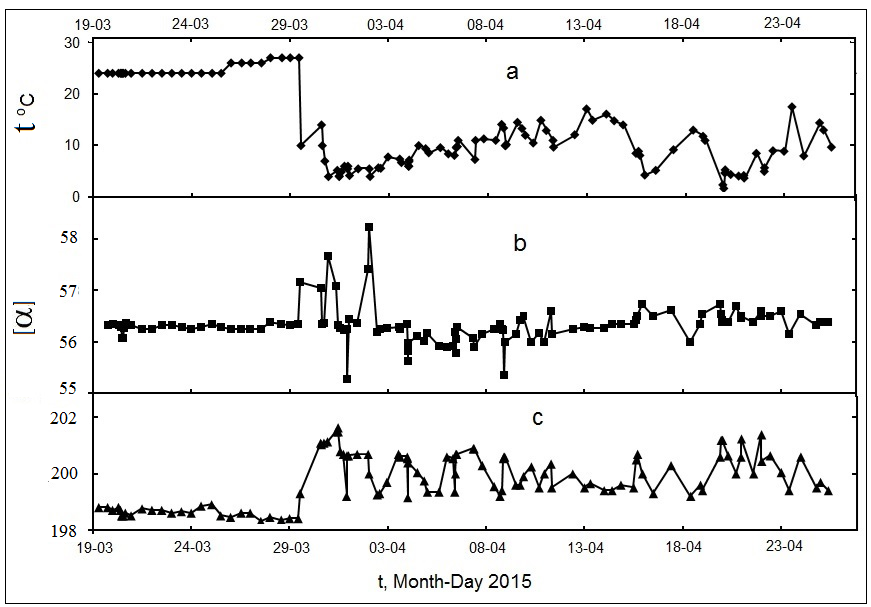
Fig. 2.
Dependences of temperature and α for glucose solution (40%, 1 dm) and dextrane solution (10%, 2 dm) on time. The polarimeter were kept in a balcony from
the 29th of March
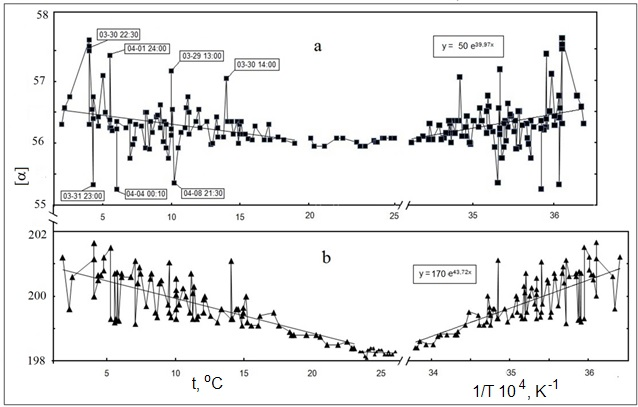
Fig. 3.
Dependences of α for glucose (a) and dextrane (b) solutions on temperature (straight line – average values) and on reverse temperature (straight line –
exponential approximation). Dates and times of registration of abnormal α fluctuations in glucose solution along with exponent parameters are given in
frames.
Figure 3 shows ТDs of rotation angle for these solution and their Arrhenius approximations. ТDs’ characteristics (ЕА, δ) in the relevant
temperature ranges (Δt), as well as [α] values measured on the wavelength of 589 nm at 20 ºС for water and chiral solutions are given in Table 2. Negative
values of [α] in Tables 1 and 2 correspond to laevorotatory solutions. Positive ЕА values correspond to TDs characterized by absolute values [α]
decreasing with t.
Table 2.
Characteristics of temperature dependences of water’s and chiral solutions’ properties
|
№
|
Water and solutions
|
[α]
(deg ml
g−1 dm−1)
|
δ (% /оС)
|
ЕА
(kJ/mol)
|
Δt (оС)
|
Ref.
|
|
1
|
Water
|
η
|
-
|
-1.5
|
21-13
|
0-100
|
[1]
|
|
τ
|
-
|
-1.6
|
21/15*
|
0-25-100
|
|
D
|
|
1.7
|
21/17
|
2-25-90
|
|
r
|
-
|
-0.04
|
1.3
|
4-100
|
|
Cp
|
-
|
-0.026/0.014
|
1.6/0.8
|
0-35-100
|
|
2
|
WQ + saccharose (5%)
|
66
|
-0.036
|
0.26
|
20-25
|
[13]
|
|
3
|
PhS + saccharose (40%)
|
66
|
-0.05
|
0.35
|
15-38
|
[9]
|
|
4
|
WQ+ ethanol (43%) + GL(23%)
|
56
|
-0.07
|
0.6
|
13-32
|
|
5
|
WQ+ ethanol (36%) + DX(6%)
|
200
|
-0.07
|
0.6
|
13-25
|
|
6
|
PhS + GL
|
56
|
-0.05
|
0.33
|
2-30
|
This work
|
|
7
|
PhS + DX
|
200
|
-0.045
|
0.36
|
2-30
|
*) – ЕА for different Δt
For t<tех. the values of EА were estimated from Arrhenius approximations of TDs shown in Figure 3 to be 0.33 kJ/mol and 0.36
kJ/mol for GL and DX, respectively (see Table 2). These values appeared to be in good agreement with EА values obtained with the use of
polarimeter in which the temperature in the measuring cell section was controlled with the help of thermal coating and thermostat [9]. Fluctuations of α
were detected at t<15ºС, and their lifetimes were of the same order of magnitude as the time of measurement (30 s to 60 s) while fluctuation amplitude
|∆α| varied in the range of 0.1º to 0.4º (see Figures 3 and 4).
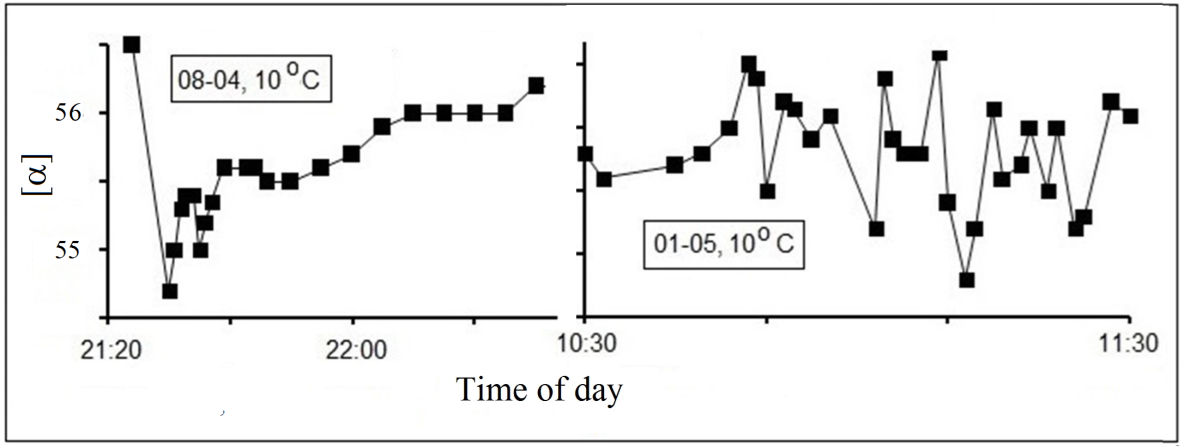
Fig. 4.
Dependence of chirality fluctuations kinetics for glucose solution (40%, 1 dm) on the date time and temperature.
Discussion
Comparison of ЕА values given in Table 2 with typical values of activation energy for rotation-oscillational levels and molecular motion (Е a) in Table 3 has proved that restructuring of А-fraction of water has to be categorized as II-type. Therefore, the conclusion can be made that
rotation of water molecules, as well as that of chiral molecules as a whole, to a major extent, defines the characteristics of TDs (ЕА, δ) for
physical properties of pure water and [α] of water solutions of sugars. and this is also true of organic solutions of terpenes. In addition, this
conclusion is supported by convergence of ЕА [α] values for sugar solutions and those of Еа for the lower rotational levels for
ortho- and para- spin-isomers of water (see Table 3). This assumption partially complies with the reported data on dependence of [α] on internal rotations
and rotational isomerism, in case of molecules having optical isomers divided by low barriers [18].
Table 3.
Activation energies of molecular motion
|
Energy of motion and excitation
|
Еа (kJ/mol)
|
|
Energy of thermal motion (Т=273-370 К)
|
2.3 to 3.1
|
|
Torsion oscillations of water molecules [16]
|
0.2 to 1.0
|
|
Excitation energy for lower rotational levels of water ortho- and para- spin-isomers [17]
|
0.38
|
|
Torsion oscillations of molecules in condensed phase [16]
|
~0.4
|
|
Deformation oscillations in molecules [16]
|
>2.8
|
|
Stretching vibrations in molecules [16]
|
>8.5
|
|
Barriers of intermolecular rotation [14.18]
|
1.7 to 13
|
|
Activation energy of mutarotation for glucose [14]
|
~75
|
Terpenes have no optical isomers, while α- and β-isomers of GL have similar values of [α] = 52.7º and are in equilibrium that, practically, cannot be
affected by mutarotation reactions in the course of registration of TDs for [α]. Saccharose and DХ are free of mutarotation. The probability of occupation
for molecular rotational levels is given by Boltzmann exponent exp(–Eа/RT). Orientation and configuration of electron system of molecules define
the interaction force (WЕ) between electric field of electromagnetic wave (of light) with the dipole induced by this field in a molecule (ΔD ~
EdΔe). Assuming that the local energy of electric field (εεоЕ2) is proportional to the frequency (hν) or reciprocal wavelength (hCλ –1) of light for rotation angle (ψ) of Е polarization plane we can obtain the following qualitative relationship:
ψ ~ WЕ ~ E ΔD cosφ ~ E2d Δe cosφ ~ λ–1d Δe cosφ, (5)
where φ is angle between vectors Е and ΔD and d is distance between electric charges Δe in the chiral fragment of the
molecule. From the wavelength depends, which fragment of the molecule determines its chirality. This is illustrated by β-pinene (see Table 1).
For [α] values given for terpenes in Table 1 for various wavelengths [15] the dependence [α] on λ–1 has been calculated for pinnae, α-pinene and
fenchone. This dependence can be regarded as an alternative one to the empiric formula connecting [α] and λ–2 [10]. It was found for terpenes
that [α] does not, practically, depend on concentration, and TDs remain linear in the range of 0 ºС to 100 ºС [15]. This is a substantiation of the idea
that there is no associated molecules and that the rotational dynamics of terpenes is not influenced by the solvent (ethylcyclohexane).
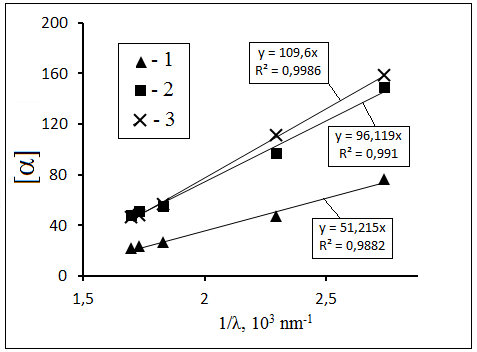
Figure 5. Dependence of optical activity of terpenes on light reciprocal wavelength: 1 – pinane, 2 – α-pinene, 3 – fenchone (based on the data from [15]).
Unlike terpenes GL [9] and saccharose are characterized by dependence of ЕА on concentration (see Table 2). Besides, their TDs have a curving in
the range of 23 ºС to 26 ºС (see Figure 3 and [9]). In [19] the method of ultraviolet radiation inelastic scattering was used to determine activation
energy ЕА=(21.5±2.0) kJ/mol in the range of 13ºС to 65ºС for НВ’s lifetime (τН) in 30% to 60% GL solutions. This value is close to Е А for τ of water in the interval 0 ºС to 25 ºС (see Table 2). Identity of frequency spectra for dielectric absorption losses for pure water and
GL solutions with concentrations up to their saturation levels has been discovered in [20]. These data show that, owing to their dimensions similar to
those of W6-cluster. GL molecules fit into the water’s НВ lattice with its minimal distortion. Therefore, we may suggest that GL molecules built
into SMSs enhance their stability thus increasing their lifetime. A similar effect takes place while adding ethanol to GL and DX solutions which is
detected through an increase of their ЕА for [α] (see Table 2). Lifetime of SMS grows by an order of magnitude when water is mixed with ethanol
[8].
In water solutions of disaccharides, ЕА for τН depends on saccharide concentration. The value of ЕА for τН in
trehalose solutions (0% to 33%) is 14k J/mol to 16 kJ/mol in temperature range 0 ºС to 100 ºС [21]. These values are in good agreement with those for Е А for τ and D of pure water at temperatures from 25 ºС to 90 ºС (see Table 2). The value of ЕА for τН in trehalose
solutions with С > 33% increases sharply attaining 30 kJ/mol for С=66% [21]. By processing the data on TDs for times of rotational relaxation (τ Т) for trehalose solutions reported in [22], the dependence of ЕА on С for trehalose has been obtained (Figure 6) similar to that of
ЕА for τН on concentration of trehalose, maltose and saccharose reported in [21]. In [22] the growth of ЕА for high
trehalose concentrations С was attributed to probable НВ formation between trehalose molecules.
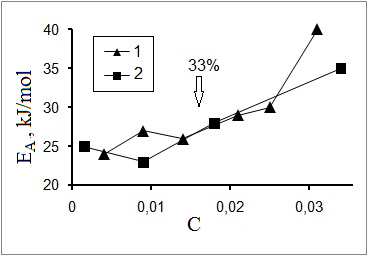
Fig. 6.
Dependence of activation energy for rotational relaxation of trehalose on molecular trehalose/water ratio. Input data were found in [22]; (1) – depolarized
optical dispersion; (2) – NMR. Arrow shows concentration corresponding to 33%.
The sharp increase of ЕА for τН and τТ in solutions of disaccharides begins from С>0.8 mol/l which corresponds to R mm<1 nm. Such Rmm values are comparable with disaccharide molecules dimensions, the first layer of their hydrate shell being taken
into account that may comprise to 17 water molecules [22]. It follows here from that dissolved molecules in disaccharide solutions and their hydrate shells
make their contribution in water molecules self-organization in SMS. That is why rotation of disaccharide molecules tends to get limited. and the life time
of water cluster structures increases.
Conclusion
Correlation of characteristics of temperature dependencies for specific rotatory power for saccharide solutions and those of pure water properties reported
in this paper indicate the key role of water dynamics in anomalies of optical activity of sugars. Curving on temperature dependencies for specific rotatory
power of sugars solutions in temperature range 20 ºС to 25 ºС is evidently conditioned by structure reforming of water’s lower-density А-fraction
responsible for kinking of temperature dependencies of water for dynamic viscosity, diffusion coefficient and dielectric relaxation time at 25 ºС. In
frames of fluctuating hydrogen bonds model [2, 3] self-assembly of А-fraction clusters and supramolecular structures in water solutions of sugars can be
categorized as a stochastic process whose dynamics and kinetics depend on temperature, structure and sugar concentrations. The amplitude and lifetime of
optical activity at temperatures below 15 ºС are defined by number of chiral molecules bound to clusters included in supramolecular structures.
References
А. Kholmanskiy, J. Mol. Struct. 1089 (2015) 124-128.
Yu. Ya. Efimov, J. Struct. Chem. 42 (2001) 1122–1126.
Yu. Ya. Efimov, Yu. I. Naberukhin. Ibid. 41 (2000) 532–536.
Р. Wernett. Science 304 (2004) 995– 999.
C. Huang, K.T. Wikfeld, T. Tokushima, et al.. PNAS. 106. (2009) 15214–15218.
S.D. Zakharov, I.V. Mosyagina. The Cluster Structure of Water (review). FIAN. 2011.
G.G. Malenkov. J. Struct. Chem. Appl. 47 (2006) 5–35.
A.N.Smirnov, A.V.Siroeshkin. Russian Chem. J. 48 (2004) 128-135.
А.S. Kholmanskiy
,
D.S.Strebkov. Dokladi RAAS. 5 (2007) 57-63.
M.V. Volkenshteyn. Molekulyarnaya optika. (1951) 744.
V.I. Slesarev. Khimiay: Osnovi Khimii Zhivogo. (2000) 768.
A. Shimkevich. I. Shimkevich. Adv. Condens. Matter Phys. 2011 (2011). Article ID 871231. http://dx.doi.org/10.1155/2011/871231.
Masago Hisashi, et al.. United States Patent 7839505 Publication Date: 11/23/2010.
Yu.S. Lyalikov. Physico-chemical methods of analysis. (1973) 536.
K.B. Wiberg,Yi-gui Wang, M. J. Murphy, et al. J. Phys. Chem. A. 108 (2004) 5559–5563.
V.A. Kizel. Practical molecular spectroscopy. (1998) 256.
V.I. Tikhonov, A.A. Volkov. Science. 296 (2002) 2363.
A.P. Terentev. Fundamentals of stereochemistry. (1964) 687.
M.E. Gallina, L. Comez, S. Perticaroli, et al. Philosophical Magazine. 88 (2008) 3991–3998
L.P. Semihina. The dielectric and magnetic properties of water in aqueous solutions and in biological objects of weak electromagnetic fields. Tyumen. 2005.
173.
A. Lerbret, F. Affouard, P. Bordat, et al. J. Phys. Chem. B 109 (2005) 11046–11057.
M. E. Gallina, L. Comez, A. Morresi, et al. J. Chem. Phys. 132 (2010) 214508.